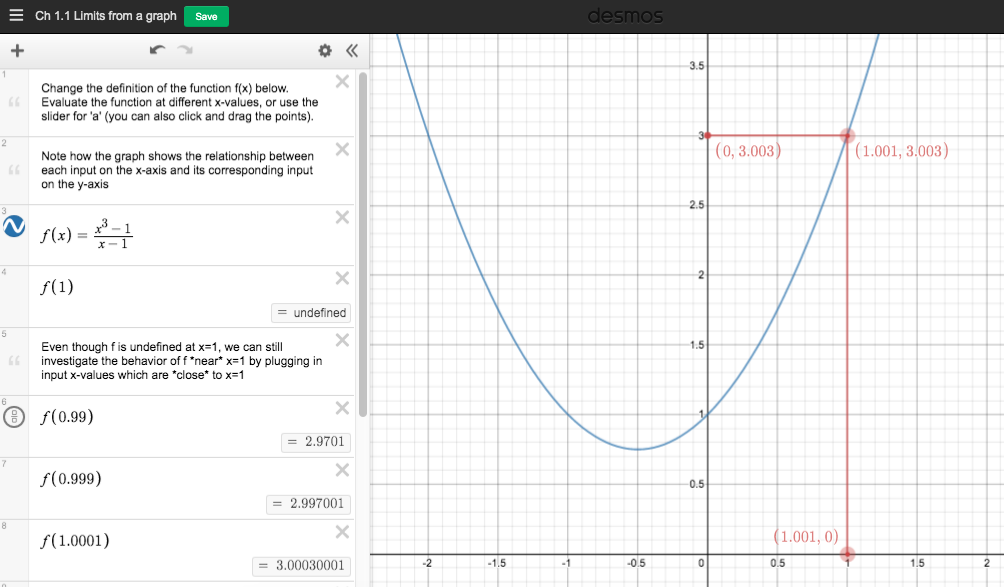
This Desmos link shows what is happening graphically when you construct a table of values to investigate a limit. Desmos is also very useful for quickly evaluating functions at several inputs (just define f(x)=……, and then type f(0.01), f(0.001), etc. in lines below it).