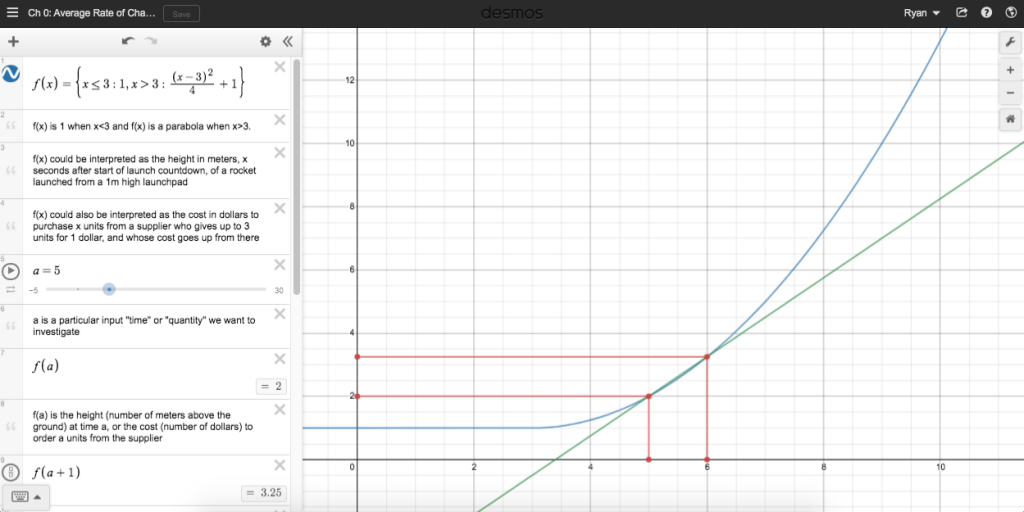
This Desmos graph gives an interactive way to think about average rates of change in the context of examples from physics and economics. You should try changing the definition of the function, and see how you can interpret the examples in that case.

This Desmos graph gives an interactive way to think about average rates of change in the context of examples from physics and economics. You should try changing the definition of the function, and see how you can interpret the examples in that case.